Tuesday, June 18, 2013

Channel Forex Trading System

Channel is one of the most traded Forex chart pattern in Foreing exchange trading. Channel trading gives good chance for beginner or expert traders to get big money. Channel chart pattern determine trending or side ways market price in Forex market in all time frame trading.

If there is no trend in Forex market (sideways), we still can make channel horizontal chart pattern. And if we have sloping channel chart pattern, we can consider it as trending market. So, the point is we can still spot trading entry and exit using channel trading chart pattern.

As you can see in the picture below, channel trading chart pattern can determine the bullish trend on the trading chart.

Channel trading chart pattern can be identified just after we decide 2 lows and 2 highs. After we drew a trading channel, we can follow this trading system:

In this situation we have two chances :
1. Market price trades in the channel range, it moves up and down like a ball.
2. Breakout chance. We can take opportunity to open a trading position in the direction of the breakout.
In the picture below the market price bounces inside the channel trading chart pattern.


But the bullish trend was not powerful enough and bullish trend movement did not survive. The market price corrected below 50% of fibonacci level and then price reversed again to the lower channel and tried to test the line or support level. Once the market price broke the support line, then we considered it as sell trading signal. And the support line change into resistance line.


We can plot our stop loss above the resistance level line, and we can set profit target based on risk and reward ratio. This is our trading money management.

YOu can use your experience trading skill in this trading system to set your profit target and stop loss order. For example we can consider again if the market price breaks support or resistance level.

In the trading example above the market price trend moved bearish, and our trade is reached the second profit target. This trading system can gives an good profits. And also this trading system is quite easy and very simple Forex trading system. The basic of this trading system are to reduce trading risk and to improve the trading profitability.

There are a lot of Forex trading system like ADX Trading strategy, Divergence Trading Strategy, Heiken ashi technique, Triple Moving Average Crossover trading, Fibocalc v31 system, Alternative Ichimoku, Fx5 divergence V3, Kuskus Starlight trading, Trend alexcud trend trading, Two bar reversal trading, Donchian breakout system, Bollinger breakout system, CCI strategie and etc.

Also, if you are interested in trading in the parallel channels, recommend to pay attention also to the strategy of sliding price channels Victor Barishpolts where you will learn how to automate trading strategy B. Barischpoltsa with a profitable forex advisor.
Bollinger Bands Scalping trading system


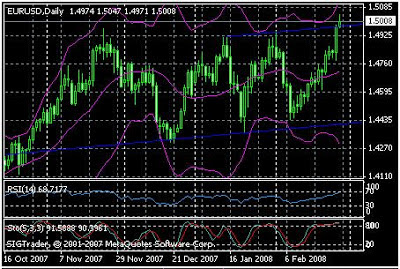
Forex trading pair: Euro Dollar EURUSD
Forex indicators: Bollinger Bands, Relative Strength Index RSI 14 period, Stochastic (5,3,3)
Time Frame: 30 minutes, 1 Hour, D1
Trading rules
- Make channel line above and below market price
- Place buy stop or sell stop order position with 20 pips distance from above / below channel
- In the D1 time frame analysis example, we saw that market price inside the channel, as you can see in the below image. In this situation we can only place stop order inside the Bollinger bands channel.
Bollinger Bands Scalping trading system
In the trading example above we can clearly see the channel inside the Bollinger bands indicator.
Place your stop loss based on risk and reward ratio.
Bollinger Bands Scalping trading system
The main problem when we are opening a trading position is placing a stop loss order. When the market price near to the market price channel line and you do not have confidence that the market price will break it, we can reanalyze our trading position and change the stop loss order on break even.
Open a trading position when the Bollinger bands indicator channel broken, you can open a trading position in the direction of the market trend.

Best Metatrader 4 Indicators


Here are the Best Metatrader 4 Indicators

Accelerator indicator
The Accelerator indicator is a very powerful technical indicator when identifying the buy and sell trading signal of a trade. You have to learn using the Accelerator indicator on bigger time frame chart to avoid you from wrong trades. The Accelerator indicator is a indicator that is made by experienced trader. Honestly I use this indicator in my own Forex trading system. This indicator has many capability that can improve your trading, Accelerator indicator is very reliable Forex indicator.
Download Accelerator indicator

3level zz semafor or 3 Semafor Indicator
3Level ZZ Semafor indicator is on of my popular forex technical indicator among so many different Forex technical indicators in Forex trading and this indicator gives many accurate trading signals.
Forex market is difficult market trading. It is important to follow the market trends in order to determine where the market trend is headed. 3level zz semafor indicator is the only indicator to improve your profitable trades.
Download 3level zz semafor

ASI indicator
ASI indicator is not like 3 semafor indicator, ASI indicator is more like RSI indicator or CCI commodity channel indicator. ASI indicator is one of the best metatrader 4 indicators in Forex market trading. ASI indicator is stand for accumulative swing index indicator, this indicator is used by experienced traders to identify trend of the currency pairs.
Download ASI indicator

Average True Range Forex
Average True Range indicator technical in Forex market measures the average range price in the market. Forex traders use this indicator to determine the stop loss level and to identify the strength of the market or volatility. You can use this indicator to calculate your trading's risk and target level.
Download Average True Range Forex

Advanced ADX
The Average Directional Movement Index indicator, referred to as the ADX Forex indicator, is an technical Forex indicator that brings you trend signals of the market price in the Forex market.
Advanced ADX indicator is one of the most traded indicator that most Forex traders line to use. This Advanced is so powerful trading indicator is because of this indicator give clear trading signals in market.
Download Advanced ADX indicator

Monday, June 17, 2013

3 Ways For Traders To Manage Unruly Emotions


Article Summary:Because trading is a flood of opportunity for both buyers and sellers, emotions often run rampant. However, making the best decision from a trading point of view is often the hardest emotional decision to make. This article will help you on the battlefield of trading by pointing out 3 key ways to keep your emotions in check so you can win the battle that so many before you have lost.
“Successful trading is always an emotional battle for the speculator, not an intelligence battle.”
-Jesse Livermore
Knowledge is paramount to trading well. There is no doubt that an understanding of different indicators to apply to a chart or understanding of the fundamental factors that show an economy’s weakness or strength can help you gain an edge. However, knowledge can only take you so far and those who focus only on knowledge or intellect are often standing in harm’s way when their money is on the line.
That harm shows up in the form of emotions. Emotions going unchecked often cause a trader to trash the concept of risk to reward or trade a very large size, which is a common predecessor to large losses. Therefore, the advanced trader would do well to know how to limit the negative effect of emotions on your trading.
Why Emotions Are A Problem?
Certainty in an executed trading idea is often a guise for greed and fear. As a trader, it is important to have a plan which focuses on entry triggers, trade size, and risk to reward ratios so that you’re acting in a mechanical manner. However, you should also be willing to exit your trade or accept the fact that moving forces in the markets can change quickly so you can avoid the painful experience of holding on to and closing out larger losses than winners.
Learn Forex: Emotions Alone Would Cause a Trader to Hold This GBPAUD Trade Short
Keep_Your_Trading_Emotions_In_Check_body_Picture_3.png, 3 Ways For Traders To Manage Unruly Emotions
Presented by FXCM’s Marketscope Charts
The opportunities in the Forex market are almost infinite. Any trader around the world can trade on any time frame using nearly any strategy. In the end though, the market will either rise or fall and regardless of your strategy for identifying an entry, you need to know when to eject from the trade idea so that you’re not holding a long position in a bear move or a short position in a bullish rip higher.
3 Focal Points to Manage Emotions
1. Earlier this week, we discussed how key the concept of uncertainty is to our trading success . This belief that anything can happen at any time should allow us to be flexible on a mental level so that we’re willing to exit a trade with mounting evidence. From the start of your trading career, you should be able to avoid holding onto to any ‘Enron trades’ that can wipe a trading career off the map because you’re looking for new data that causes you to exit the trade.
2. Trade size is something that is more paramount to overall trading success than many new traders realize. Most new traders will run out to find and buy the hottest system on the market, which was likely optimized and back tested in market conditions that aren’t present and won’t perform close to their intended results. Here is a quote from a famous trader, Larry Williams that many admire after his great trading book, How I Made One Million Dollars…Last Year…Trading Commodities, hit the shelves in 1979 that discusses trade size:
“Thus, what we need to do is under-bet our system or approach. Do not put as much money behind the system as the numbers from the past suggest you can. For most of us a 5% risk factor is all that’s needed to do rather well in this business…Under-trade, under-bet and you will be overwhelmed with your results...”
-Larry R. Williams
Personally, I’ve noted that a smaller trade size keeps me more objective on exiting a trade as well as allows me to stay in trades longer. Objectivity leads me to focus on reasons to exit a trade when the facts supporting the trade change. The smaller trade size also encourages me to stay in a trend longer because I’m not as eager to close at the trade at the current profit but rather let the trend run its course which often surpasses what I expect. To learn other ways to manage your risk, you can register for our free online course here.
Learn Forex: Small Trade Sizes Allow Traders to Emotionally Ride Out a Trend
Keep_Your_Trading_Emotions_In_Check_body_Picture_2.png, 3 Ways For Traders To Manage Unruly Emotions
3. Lastly, a focus on exiting strategies over entries will give you a healthier view of the market. Many traders use candlesticks or an overbought / oversold reading on the Relative Strength Index (RSI) to get out of a move. The key point is that when traders focus only on the entry, they’re often likely to hold onto a losing trade until it breaks even and that is often the death-nail of a trader’s career that we heartily recommend you to avoid.

The Basics of a Forex Breakout

Article Summary: Trading a breakout strategy is easy to implement in the Forex market. Learn how to begin trading breakouts today!

Price breakouts are a market condition that occur after price action either rises above resistance or drops below support. Savy traders that are aware of these conditions can quickly adapt their trading plan and be prepared to take advantage of the next market move. To be better prepared for these scenerios, today we will examine the basics of trading Forex breakouts.
Learn Forex –EURUSD Daily Breakout
The_Basics_of_a_Forex_Breakout_body_Picture_1.png, The Basics of a Forex Breakout
(Created using FXCM’s Marketscope 2.0 charts)
Many traders choose to trade breakouts due to their simplicity and effectiveness. To begin, traders will use entry orders to establish a price where they wish to enter into the market. If the price you select becomes available for trading your order will then be executed. This can be a huge benefit to traders that can’t monitor the market 24Hrs a day. Even if you’re away from the trading screen, if the price you select becomes available, after a breakout in the market, your trade will be executed. Let’s look at an example using the EURUSD.
To take advantage of a breakout on the EURUSD, entry orders should be placed above a point of resistance in its current uptrend. In the chart below, resistance has been identified as the current peak on the daily chart at1.3389. Orders should be set above this point, so in the event that price breaks through orders will already be set and waiting for execution. To limit risk, traders will also include a stop underneath current resistance levels to exit a position in the event that it reverses.
Learn Forex –EURUSD Basic Breakout Strategy
The_Basics_of_a_Forex_Breakout_body_Picture_6.png, The Basics of a Forex Breakout
(Created using FXCM’s Marketscope 2.0 charts)
As you can see trading breakouts can be an effective way to time market entries. However, for those that are looking to spend less time in front of their charts, traders can consider trading an automated breakout strategy using FXCMs Mirror Trader. Using the Mirror Trader software, traders can select from a variety of breakout strategies. This includes both the Breakout 1 and Breakout 2 DailyFX PLUS trading signals which can be applied to over 14 different currency pairs.

Breakout Trades and the Power of Price Channels

Breakout Trades and the Power of Price Channels

When Price Channels (sometimes referred to as Donchian Channels) are placed on a chart, they identify the high and the low price at which the pair traded over a specified period of time. The Channels on the Daily chart below are set to 20 periods so they would represent the high and the low at which the pair traded over the previous 20 days.
As such, they can be used quite effectively to visually identify levels of Support and Resistance on a chart. The channels can be used by “breakout” traders to identify entry levels. This would occur when price “breaks” below support in a downtrend or above resistance in an uptrend.
When the breakout occurs, this can be taken as an entry signal as the potential exists for price to continue to move in that direction for a period of time.
Let’s take a look at the example below of Price Channels on a Daily chart…
Breakout_Trades_and_the_Power_of_Price_Channels_body_eurcad_dnc_5_9.png, Breakout Trades and the Power of Price Channels
As noted on the chart, the lower channel line represents support while the upper channel line represents resistance.
As with most every strategy, the first step is to determine the direction that we should trade the pair. In the case of the EURCAD pair we know we want to look for opportunities to short the pair for the following reasons: 1) Price Action is below the 200 SMA and is pulling away from it; 2) at the time of this writing the EUR is weaker than the CAD, and 3) price has been making successively lower highs on this Daily chart since the end of February.
Now that we have determined the direction to trade the pair, we can look to a lower time frame chart to “fine tune” our entry. For our purposes on this pair, I prefer the 1 hour chart as we may be close to an entry.
When moving down to an intra-day chart (anything below a Daily) we will change the indicator to 55 periods. We do this to slow down the indicator a bit as we have moved to a faster, lower time frame chart.
Breakout_Trades_and_the_Power_of_Price_Channels_body_dnc_5_9.png, Breakout Trades and the Power of Price Channels
If/when price breaks below the lower channel line at 1.2941 a trader could sell the pair. The stop would be placed above the upper channel line at 1.3041. As can be seen, the price channels have provided us with our “breakout” entry along with our stop placement.
To manage the trade as it progresses, a trader would manually trail the stop by keeping it just above the upper channel line. The trade would be closed when price action retraces to the point that it intersects the upper channel line and the stop.
Since Price/Donchian Channels are not an indicator that is built into the Marketscope charting package, instructions are needed to install them.

Sunday, June 16, 2013

Weekly Forex Trading Forecast: Fed Decision Expected to Rock the FX Market

The Dow Jones FXCM Dollar (ticker = USDollar) endured a critical tumble this past week – a move that threatens to seismically alter a nine-month bull trend for the currency. Yet, both technical break and trend ambitions can be immediately reversed by one critical piece of event risk: the Federal Reserve’s June rate decision.
The Euro finished higher against the US Dollar for the fourth-consecutive trading week, good for its largest win streak since September and leaving it poised to test fresh peaks.
The Bank of Japan is firmly on hold despite recent volatility in Japanese financial instruments, which keeps the bull case for the Japanese Yen intact. Furthermore, with US Treasury yields set to fall and European peripheral yields set to rise, the Yen looks well-suited to gain further against the Euro and the US Dollar.
The British Pound extended the rebound carried over from the previous month, with the GBPUSD climbing to a fresh monthly high of 1.5736, and the sterling may continue to appreciate next week should the fundamental developments coming out of the U.K. further dampen speculation for additional monetary support.
Gold crept higher this week with the precious metal posting a modest advance of just 0.36% to trade at $1387 at the close of trade in New York on Friday. Bullion price action has remained rather subdued despite the wide spread volatility seen in FX and broader equity markets with prices continuing to hold steadily below the $1400-threshold. All eyes now turn to key event risk next week as prices continue to coil into a clearly defined range.
Use the DailyFX-Plus Technical Analyzer to identify possible trade setups.
Weekly_Forex_Trading_Forecast_Fed_Decision_Expected_to_Rock_the_FX_Market_body_Picture_1.png, Weekly Forex Trading Forecast: Fed Decision Expected to Rock the FX Market